
The Data Selfie
The narrative in numbers.

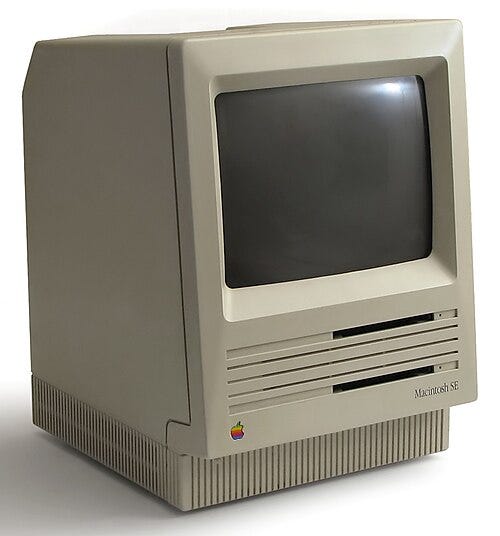
My eyesight is terrible. It’s especially bad when I first wake up, like the boot up of my 1980’s era computer, the Macintosh SE, my eyes seem to need time to download the launch software of perceiving the world. It’s an advantage to be forced to wait for the world to come into focus, I can’t reach for a screen, it would all be a blur in my eyes anyways. I can allow my thoughts to do their swimming into focus. I’ve always had to be conscious about how I see the world. I still remember very vividly the day I received my first set of glasses, the car ride home —-seeing leaves on trees and the tracery of wires strung on poles and the features of my mother’s face.
Using a lens to understand or view a subject is a loaded term for me, freighted with decades of eye issues. The thick glass that I need to see the world through has made me hyper aware of the ways we are shown our world. I like the idea of the lens as I live with them literally and conceptually—-the lens of data. If you are an educator you can’t avoid data and you are involved in adding more data to the picture you use to determine success or meeting a learning outcome.
Academic processes that utilize data, and surveys, rely on finding a story in the numbers, and this is where looking through a glass darkly is best expressed—numbers and data are not truth. Data has truth immunity, the perfect definition of Frankfurt’s Bullshit—not opposed to truth—lying, just completely indifferent to it. Look at the manipulations that economists and social scientists have named like Goodhart’s Law:
"When a measure becomes a target, it ceases to be a good measure,"
Here is a Wikipedia dump of concepts related to data and statistics: Campbell’s law, the Cobra effect, Confirmation bias, Gaming the system, Map-territory relations, McNamara fallacy, Metric fixation, Peter principle, Reification fallacy, Reflexivity, and Reward Hacking. I went to art school and never took a Statistics course, so these concepts are likely just the hors d’oeuvres for the banquet of theory about data.
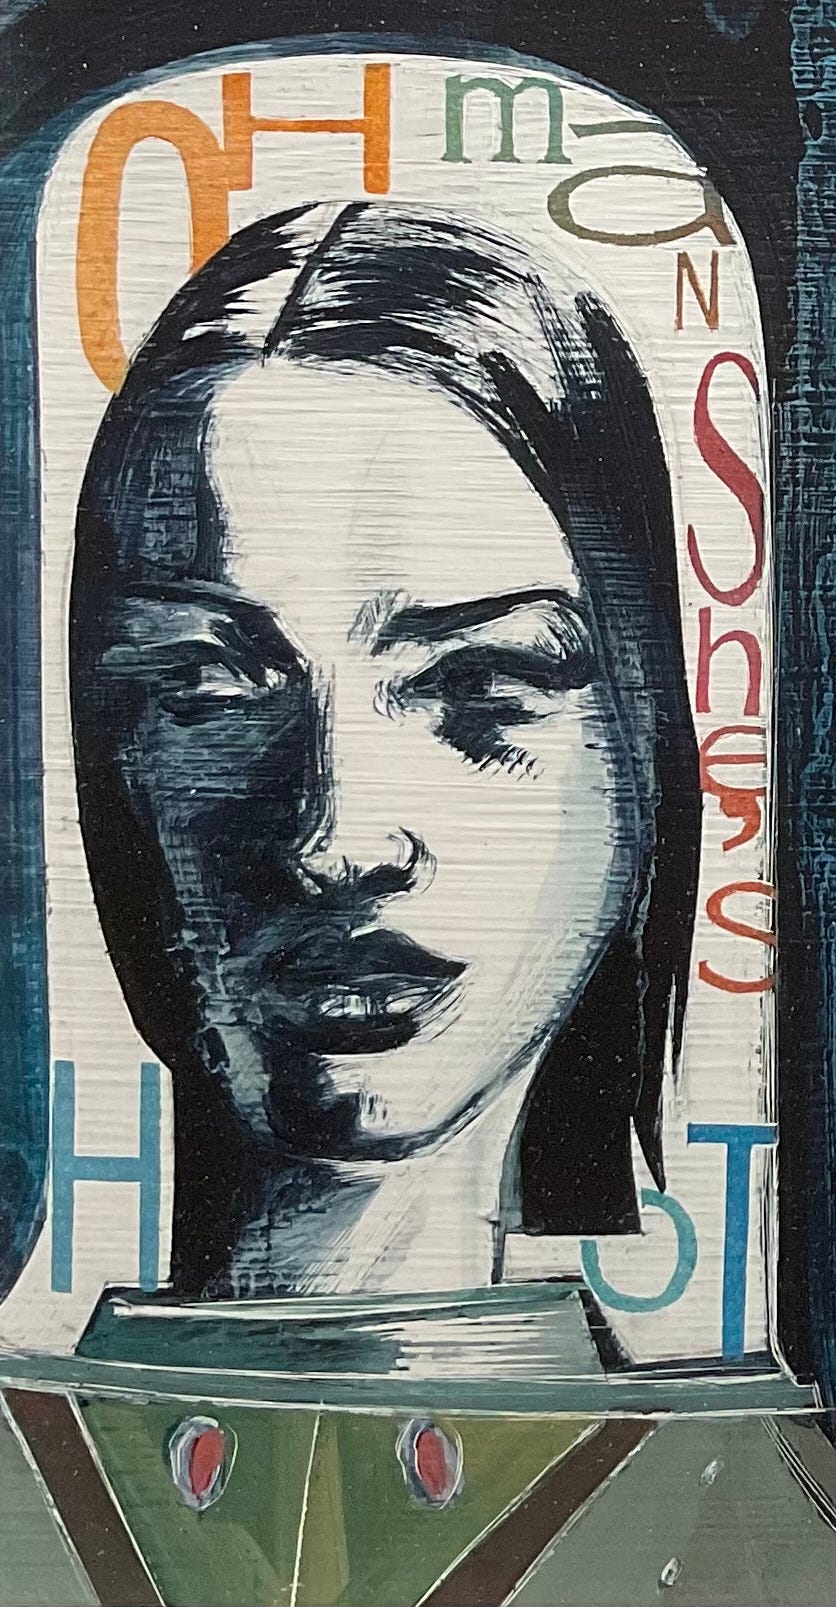
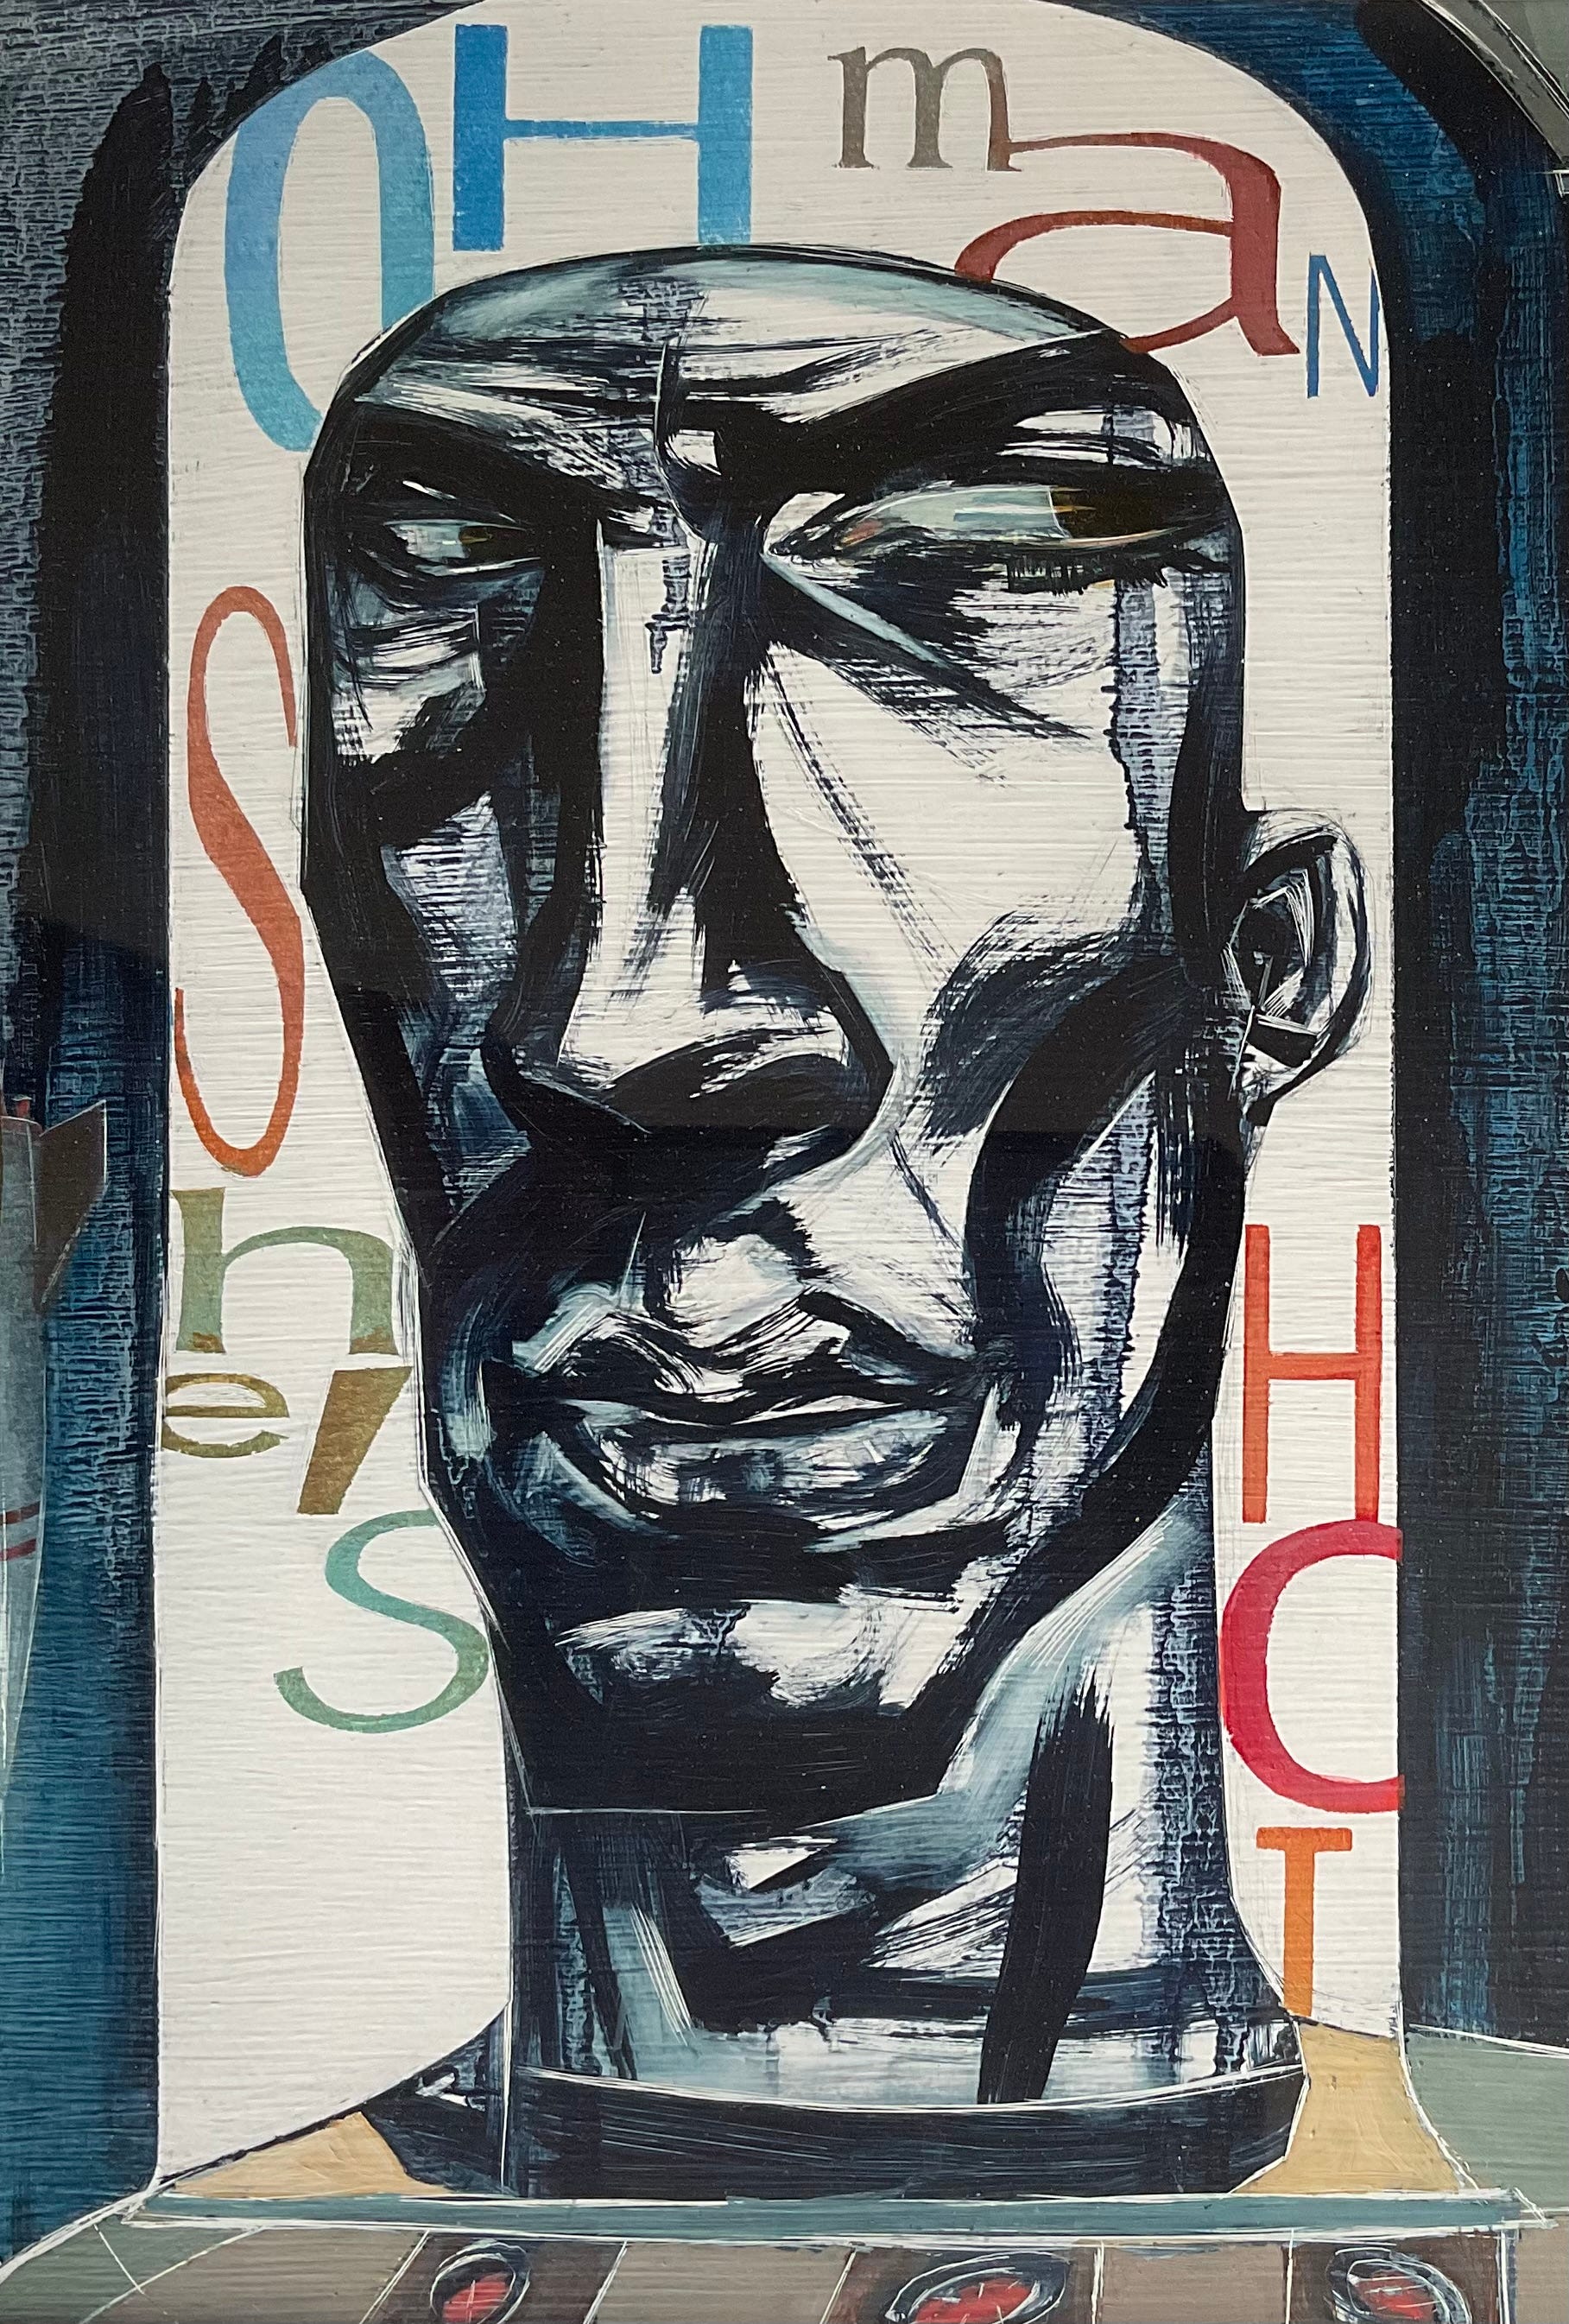
To return to the glasses on my nose. My eyes see double all the time. My glasses makes one of those images sharp(ish) and my brain knocks out the less clear image so that I can see what is infront of me. The second image appears when I’m tired or spend too much time on this damn screen I am typing into—-my brain has only so much bandwidth to keep up the illusion.
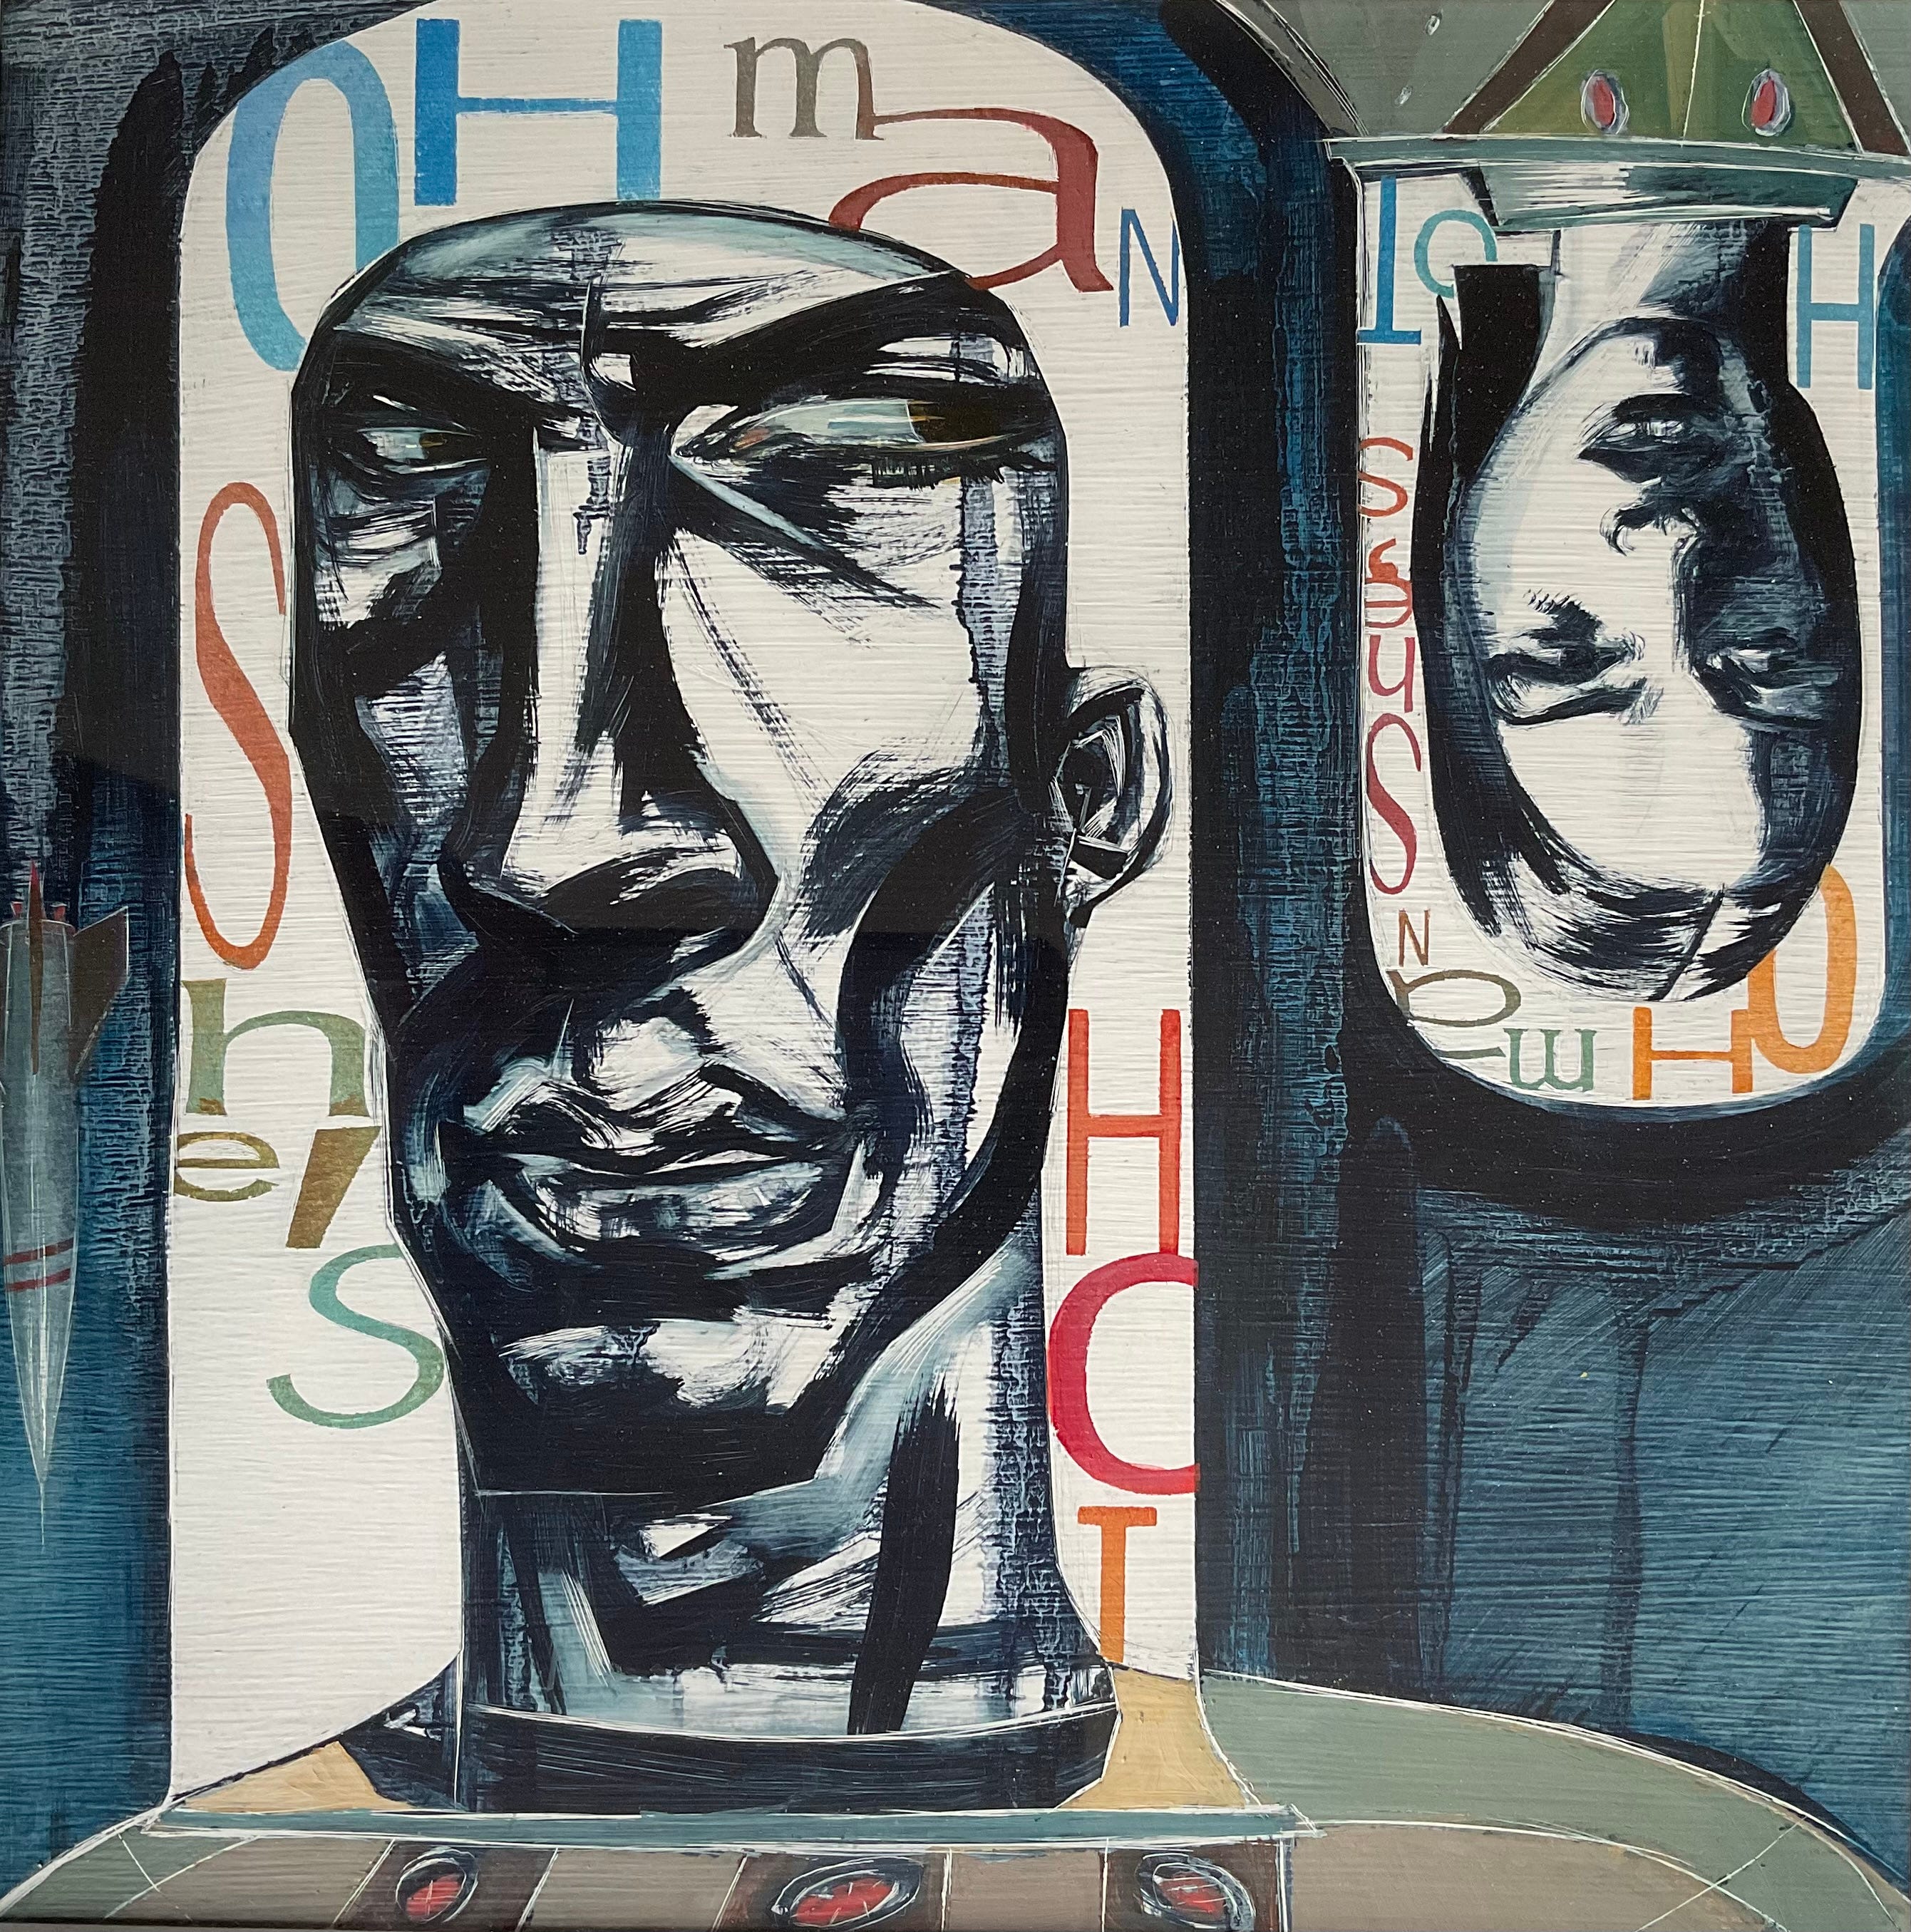
Data just won’t leave us alone—-usage, analytics, metrics, your steps, your deep sleep—like the blurry double image I see with fatigue, we have a data selfie to contend with. How I see is not an unconscious given but an ever present reality, I envy you folks that can just turn on the switch of seeing clearly by opening your eyes. I suspect the hard won consciousness of seeing is why I became a visual artist.
It takes more than the flutter of an eyelid to see clearly, when our vision is filled by data. The lens of measurement that we see our world through and the prescriptions offered are doing the opposite as advertised. They should help us make more informed decisions and spark the questions to ask rather than the dull hum of our choices and decisions atomized into data chunks and fed back into the stream. The narrative in the numbers doesn’t hear your story, it reduces all of our sharp edges into the smooth object of a single answer, “And the survey says…”
As somehow only started to need glasses later in life, it is interesting to read your point of view on vision, especially as and artist/illustrator.